Note
This page was generated from a jupyter notebook.
Using SedimentPulserEachParcel to add sediment parcels to a channel network
This tutorial illustrates how to use SedimentPulserEachParcel with a network model grid and the NetworkSedimentTransporter.
SedimentPulserEachParcel overview: The user specifies the link and distance on link that parcels are placed within a channel network in a Pandas DataFrame.
In this example we will:
Set up a network model grid with an initial set of parcels,
Add pulses of sediment to the grid using SedimentPulserEachParcel, and
Run NetworkSedimentTransporter between pulses
1. Setup the work space
[1]:
import matplotlib.pyplot as plt
import numpy as np
import pandas as pd

from landlab.components import FlowDirectorSteepest, NetworkSedimentTransporter
from landlab.components.network_sediment_transporter.bed_parcel_initializers import (
    BedParcelInitializerArea,
)
from landlab.components.network_sediment_transporter.sediment_pulser_each_parcel import (
    SedimentPulserEachParcel,
)
from landlab.grid.network import NetworkModelGrid
from landlab.plot import graph, plot_network_and_parcels
2. Define the network model grid topology
[2]:
x_of_node = (0, 0, 100, -50, -100, 50, -150, -100)
y_of_node = (0, 100, 200, 200, 300, 400, 400, 125)
nodes_at_link = ((1, 0), (1, 2), (7, 1), (3, 1), (4, 3), (5, 4), (6, 4))
nmg = NetworkModelGrid((y_of_node, x_of_node), nodes_at_link)
to help visualize where the pulses will be sent, plot the network with link and node id numbers
[3]:
fig, axs = plt.subplots(1, 1, figsize=(4, 6))
graph.plot_links(nmg, with_id=True)
graph.plot_nodes(nmg, with_id=True)

3. Define required link and node fields and run a flow director on the grid to add a slope field
[4]:
nmg.at_link["channel_width"] = np.array([3, 1.5, 2.5, 2, 2.5, 1.5, 2])  # m
nmg.at_link["channel_slope"] = np.array(
    [0.05, 0.1, 0.06, 0.08, 0.07, 0.1, 0.08]
)  # m / m
nmg.at_link["reach_length"] = np.array(
    [100.0, 103.1, 111.8, 141.4, 111.8, 111.8, 180.3]
)  # m
nmg.at_node["topographic__elevation"] = np.array([0.0, 5, 10, 10, 10, 15, 20, 20])
nmg.at_node["bedrock__elevation"] = np.array([0.0, 5, 10, 10, 10, 15, 20, 20])
nmg.at_link["drainage_area"] = np.array([1, 0.1, 0.625, 0.15, 0.4, 0.075, 0.2])  # km^2
nmg.at_link["flow_depth"] = np.array([0.7, 0.4, 0.6, 0.4, 0.5, 0.4, 0.4])  # m

# instantiate and run flow director
flow_director = FlowDirectorSteepest(nmg, "topographic__elevation")
flow_director.run_one_step()
4. Create an initial set of parcels on the grid.
Note, we start with a small number of initial parcels so that parcels from later pulses of material are visible in plots of the parcels and network
[5]:
initialize_parcels = BedParcelInitializerArea(
    nmg,
    drainage_area_coefficient=0.1,
    drainage_area_exponent=0.2,
    median_number_of_starting_parcels=2,
)
parcels = initialize_parcels()
/Users/runner/work/landlab/landlab/.nox/test-notebooks-3-13/lib/python3.13/site-packages/landlab/components/network_sediment_transporter/bed_parcel_initializers.py:82: UserWarning: at least one link has only [3 1 3 2 2 1 3] parcels.
  variables, items = _parcel_characteristics(
View the initial parcels on the network model grid, shaded by grain diameter
[6]:
fig = plot_network_and_parcels(
    nmg,
    parcels,
    parcel_time_index=0,  # index of time, not the time value
    parcel_color_attribute="D",
    parcel_size=10,
    parcel_alpha=1.0,
    figsize=(3, 6),
)

Viewing the element id of the parcels in the network shows that ParcelInitializer added 15 parcels to the network
[7]:
parcels.dataset["element_id"]
[7]:
<xarray.DataArray 'element_id' (item_id: 15, time: 1)> Size: 120B
array([[0],
       [0],
       [0],
       [1],
       [2],
       [2],
       [2],
       [3],
       [3],
       [4],
       [4],
       [5],
       [6],
       [6],
       [6]])
Coordinates:
  * item_id  (item_id) int64 120B 0 1 2 3 4 5 6 7 8 9 10 11 12 13 14
  * time     (time) float64 8B 0.0
Attributes:
dtype: <class 'int'>5. Instantiate and run the NetworkSedimentTransporter component using a flow event with flow depth equal to the link field “flow_depth” that last 24 hours
[8]:
nst = NetworkSedimentTransporter(
    nmg,
    parcels,
    flow_director,
    bed_porosity=0.3,
    g=9.81,
    fluid_density=1000,
    transport_method="WilcockCrowe",
    active_layer_method="Constant10cm",
)
[9]:
nst.run_one_step(dt=3600 * 24)
/Users/runner/work/landlab/landlab/.nox/test-notebooks-3-13/lib/python3.13/site-packages/landlab/data_record/data_record.py:601: FutureWarning: In a future version of xarray the default value for join will change from join='outer' to join='exact'. This change will result in the following ValueError: cannot be aligned with join='exact' because index/labels/sizes are not equal along these coordinates (dimensions): 'time' ('time',) The recommendation is to set join explicitly for this case.
  self._dataset = xr.merge((self._dataset, ds_to_add), compat="no_conflicts")
View parcel locations after the flow event
[10]:
fig = plot_network_and_parcels(
    nmg,
    parcels,
    parcel_time_index=1,  # index of time, not the time value
    parcel_color_attribute="D",
    parcel_size=10,
    parcel_alpha=1.0,
    figsize=(3, 6),
)

Note that none of parcels moved because the partial initializer places all parcels in the inactive layer
6. Instantiate SedimentPulserEachParcel
SedimentPulserEachParcel is instantiated with a network model grid. Optionally, default parcel attributes and a parcel DataRecord can be defined. If a parcel DataRecord is not provided, SedimentPulserEachParcel will create a new parcel DataRecord.
[11]:
make_pulse = SedimentPulserEachParcel(
    nmg, parcels=parcels, parcel_volume=1
)  # set the default max parcel_volume as 1 m^3
7. create the PulseDF (Pulse DataFrame).
Each row of the PulseDF contains information on the deposition location and volume of a single pulse of sediment. The pulse is divided into ‘n’ number of parcels, where ‘n’ equals numpy.ceil(pulse volume / max parcel volume) For details on the format of the PulseDF, see the docstring for function SedimentPulserEachParcel._sediment_pulse_dataframe
Here we send a pulse to specific locations on links 1, 3, 5 and 2(see first figure for link id’s)> Note that any parcel attributes not specified use default values. Default values can be set when SedimentPulserAtLinks is instantiated.
[12]:
time = nst.time
# volume of each pulse
PulseDF = pd.DataFrame(
    {
        "pulse_volume": [50, 5, 10, 15],
        # pulses enter channel network at these links
        "link_#": [1, 3, 5, 2],
        # the normalized distance on the link (distance from link inlet / link length)
        "normalized_downstream_distance": [0.8, 0.7, 0.5, 0.2],
    }
)
[13]:
parcels = make_pulse(time, PulseDF)
/Users/runner/work/landlab/landlab/.nox/test-notebooks-3-13/lib/python3.13/site-packages/landlab/data_record/data_record.py:790: FutureWarning: In a future version of xarray the default value for join will change from join='outer' to join='exact'. This change will result in the following ValueError: cannot be aligned with join='exact' because index/labels/sizes are not equal along these coordinates (dimensions): 'time' ('time',) The recommendation is to set join explicitly for this case.
  self._dataset = xr.merge((self._dataset, ds_to_add), compat="no_conflicts")
/Users/runner/work/landlab/landlab/.nox/test-notebooks-3-13/lib/python3.13/site-packages/landlab/data_record/data_record.py:790: FutureWarning: In a future version of xarray the default value for join will change from join='outer' to join='exact'. This change will result in the following ValueError: cannot be aligned with join='exact' because index/labels/sizes are not equal along these coordinates (dimensions): 'item_id' ('item_id',) The recommendation is to set join explicitly for this case.
  self._dataset = xr.merge((self._dataset, ds_to_add), compat="no_conflicts")
view the location of the new parcels from the pulse.
Note that all parcels from a pulse are placed at the same point in the network and appear as 4 points on the plot
[14]:
fig = plot_network_and_parcels(
    nmg,
    parcels,
    parcel_time_index=1,  # index of time, not the time value
    parcel_color_attribute="D",
    parcel_size=10,
    parcel_alpha=1.0,
    figsize=(3, 6),
)

Viewing the element id of the parcels in the network shows that we actually added roughly 80 new parcels
[15]:
parcels.dataset["element_id"]
[15]:
<xarray.DataArray 'element_id' (item_id: 95, time: 2)> Size: 2kB
array([[ 0., -2.],
       [ 0.,  0.],
       [ 0.,  0.],
       [ 1.,  1.],
       [ 2.,  2.],
       [ 2.,  2.],
       [ 2.,  2.],
       [ 3.,  3.],
       [ 3.,  3.],
       [ 4.,  4.],
       [ 4.,  4.],
       [ 5.,  5.],
       [ 6.,  6.],
       [ 6.,  6.],
       [ 6.,  6.],
       [nan,  1.],
       [nan,  1.],
       [nan,  1.],
       [nan,  1.],
       [nan,  1.],
...
       [nan,  5.],
       [nan,  5.],
       [nan,  5.],
       [nan,  5.],
       [nan,  5.],
       [nan,  2.],
       [nan,  2.],
       [nan,  2.],
       [nan,  2.],
       [nan,  2.],
       [nan,  2.],
       [nan,  2.],
       [nan,  2.],
       [nan,  2.],
       [nan,  2.],
       [nan,  2.],
       [nan,  2.],
       [nan,  2.],
       [nan,  2.],
       [nan,  2.]])
Coordinates:
  * item_id  (item_id) int64 760B 0 1 2 3 4 5 6 7 8 ... 87 88 89 90 91 92 93 94
* time (time) float64 16B 0.0 8.64e+04now apply another 24 hr flow event
[16]:
nst.run_one_step(dt=3600 * 24)
/Users/runner/work/landlab/landlab/.nox/test-notebooks-3-13/lib/python3.13/site-packages/landlab/data_record/data_record.py:601: FutureWarning: In a future version of xarray the default value for join will change from join='outer' to join='exact'. This change will result in the following ValueError: cannot be aligned with join='exact' because index/labels/sizes are not equal along these coordinates (dimensions): 'time' ('time',) The recommendation is to set join explicitly for this case.
  self._dataset = xr.merge((self._dataset, ds_to_add), compat="no_conflicts")
View parcel locations after the flow event
[17]:
fig = plot_network_and_parcels(
    nmg,
    parcels,
    parcel_time_index=2,  # index of time, not the time value
    parcel_color_attribute="D",
    parcel_size=10,
    parcel_alpha=1.0,
    figsize=(3, 6),
)

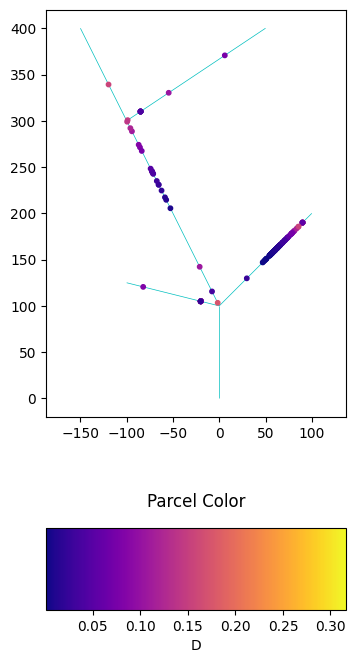
Notice that after the flow event, the parcels at each pulse location spread out.
8. Send a second pulseDF
This pulseDF includes two pulses:
A 30 m^3 landslide in thin-bedded siltstone near the channel head (inlet) of link 3
A 50 m^3 bedrock landslide in fractured, massive sandstone beds near the outlet of link 6
[18]:
time = nst.time
PulseDF = pd.DataFrame(
    {
        "pulse_volume": [30, 50],  # pulse volume
        "link_#": [3, 6],  # link id
        "normalized_downstream_distance": [0.1, 0.9],  # distance on link
        "D50": [0.02, 0.5],  # median grain size
        "abrasion_rate": [0.1, 0.01],  # abrasion rate
        "parcel_volume": [0.25, 2],
    }
)  # parcel volume
[19]:
parcels = make_pulse(time, PulseDF)
/Users/runner/work/landlab/landlab/.nox/test-notebooks-3-13/lib/python3.13/site-packages/landlab/data_record/data_record.py:790: FutureWarning: In a future version of xarray the default value for join will change from join='outer' to join='exact'. This change will result in the following ValueError: cannot be aligned with join='exact' because index/labels/sizes are not equal along these coordinates (dimensions): 'time' ('time',) The recommendation is to set join explicitly for this case.
  self._dataset = xr.merge((self._dataset, ds_to_add), compat="no_conflicts")
/Users/runner/work/landlab/landlab/.nox/test-notebooks-3-13/lib/python3.13/site-packages/landlab/data_record/data_record.py:790: FutureWarning: In a future version of xarray the default value for join will change from join='outer' to join='exact'. This change will result in the following ValueError: cannot be aligned with join='exact' because index/labels/sizes are not equal along these coordinates (dimensions): 'item_id' ('item_id',) The recommendation is to set join explicitly for this case.
  self._dataset = xr.merge((self._dataset, ds_to_add), compat="no_conflicts")
view the new parcels
[20]:
fig = plot_network_and_parcels(
    nmg,
    parcels,
    parcel_time_index=2,  # index of time, not the time value
    parcel_color_attribute="D",
    parcel_size=10,
    parcel_alpha=1.0,
    figsize=(3, 6),
)

apply another day long flow event
[21]:
nst.run_one_step(dt=3600 * 24)
/Users/runner/work/landlab/landlab/.nox/test-notebooks-3-13/lib/python3.13/site-packages/landlab/data_record/data_record.py:601: FutureWarning: In a future version of xarray the default value for join will change from join='outer' to join='exact'. This change will result in the following ValueError: cannot be aligned with join='exact' because index/labels/sizes are not equal along these coordinates (dimensions): 'time' ('time',) The recommendation is to set join explicitly for this case.
  self._dataset = xr.merge((self._dataset, ds_to_add), compat="no_conflicts")
[22]:
fig = plot_network_and_parcels(
    nmg,
    parcels,
    parcel_time_index=3,  # index of time, not the time value
    parcel_color_attribute="D",
    parcel_size=10,
    parcel_alpha=1.0,
    figsize=(3, 6),
)